Molecular Data Page Overview
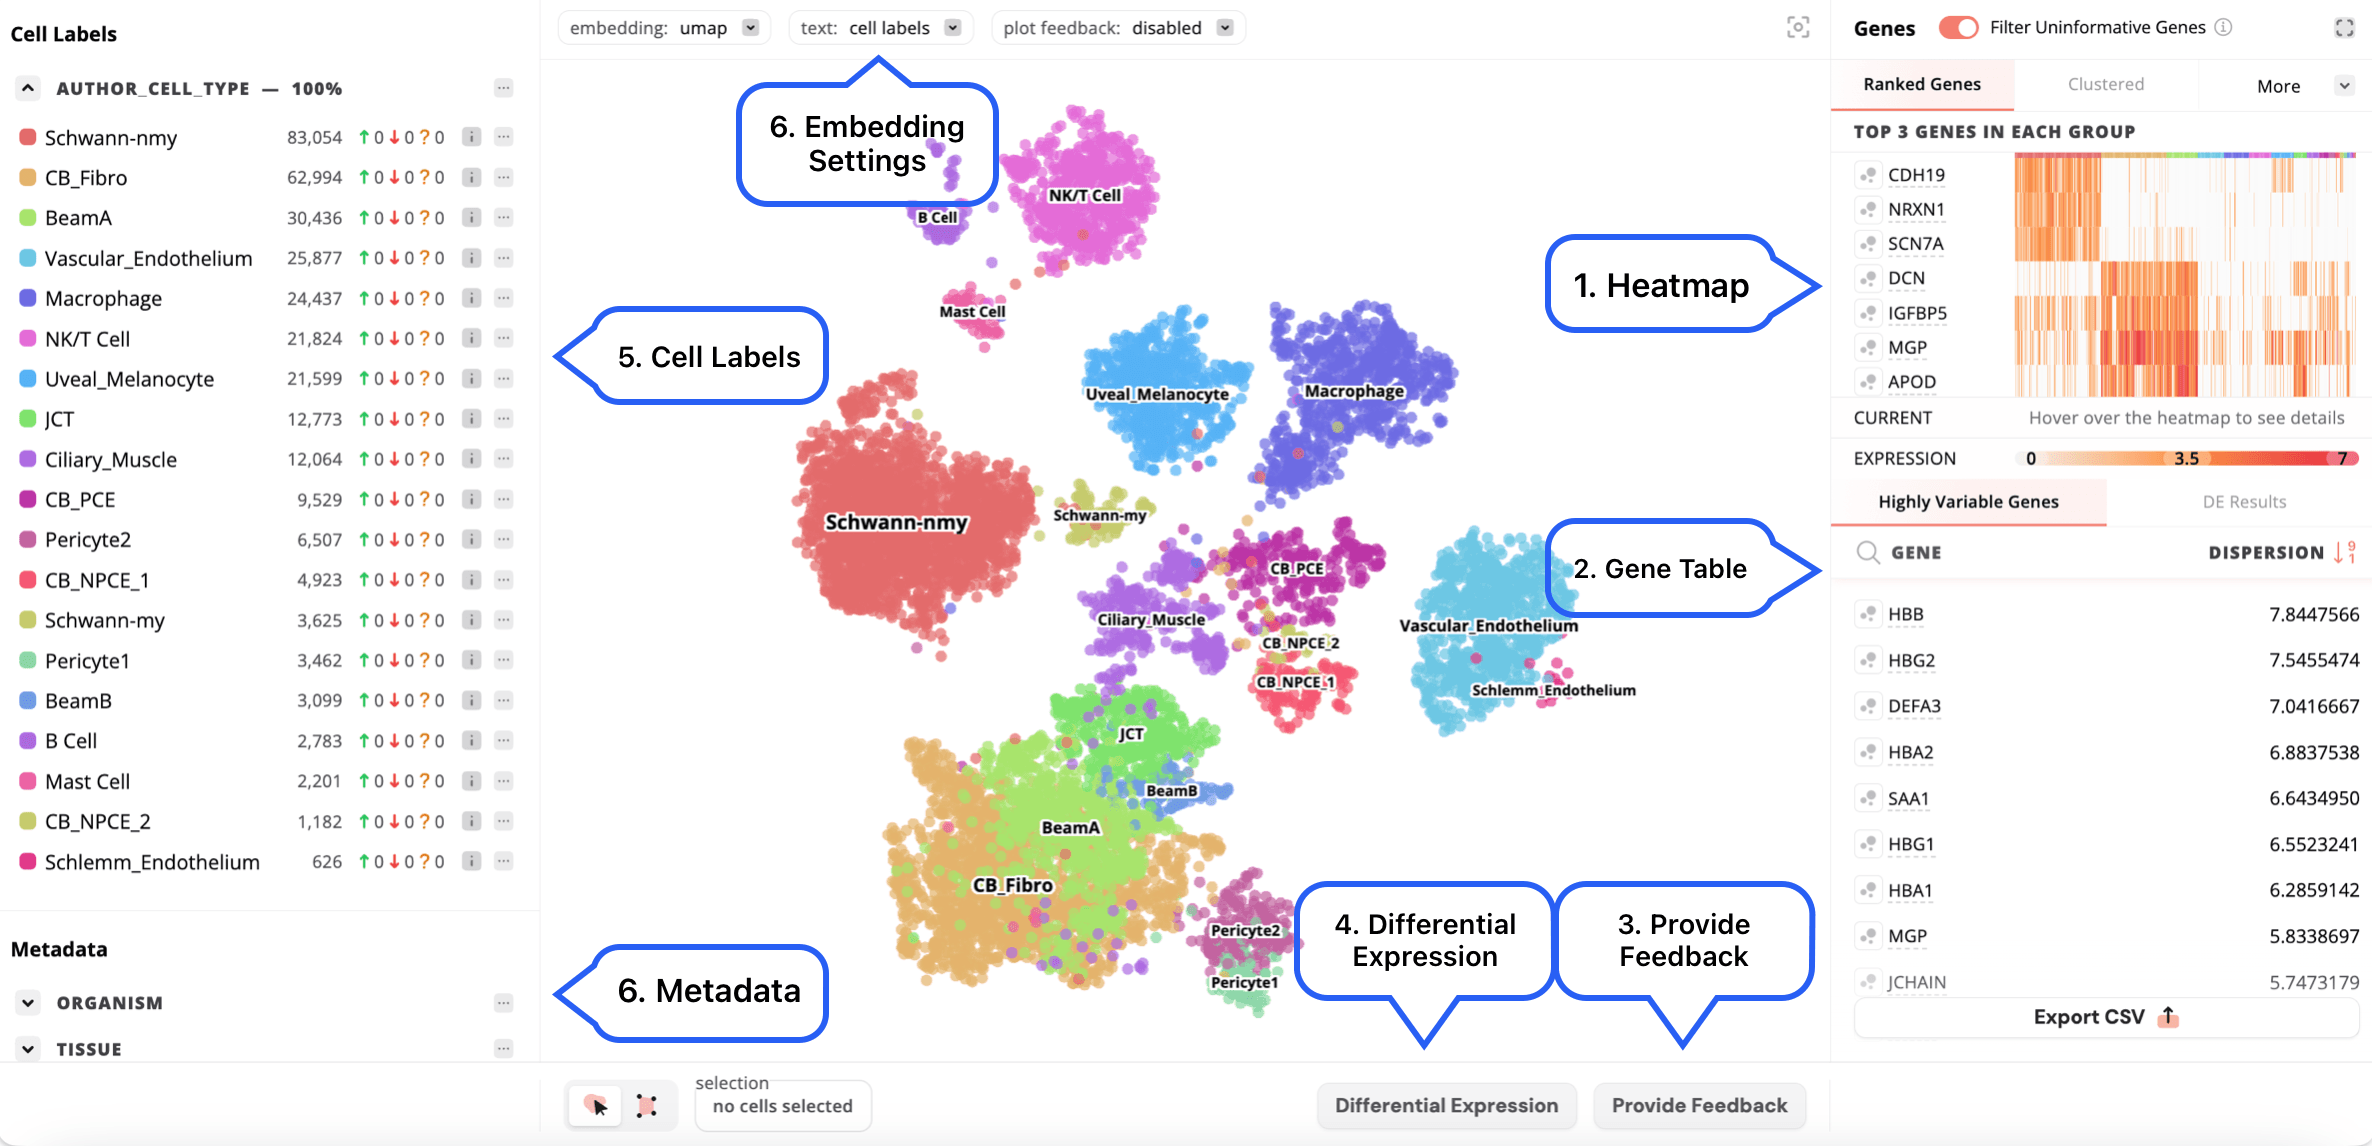
The Molecular Data page has several functions including: creating new cell labels, running differential expression and viewing embeddings with gene expression values. More information about the molecular data page features can be found on their individual documentation pages in the Molecular Data section.

- Heatmap: Displays the top 3 genes per cluster with the color-coded bar above the heatmap indicating the cluster. Users can also access Clustered, Marker Genes and Custom heatmaps. An expanded view can be accessed using the button in the top right section of the heatmap.
- Gene table: Displays the highly variable genes and the log-transformed dispersion values. Initially, the gene dispersion values are calculated over the log-transformed count matrix, these dispersion values are then log-transformed again before being displayed in the gene table. Additionally, the differential expression results will be shown here after running this analysis. The buttons to the left of each gene control the display of gene expression on the embedding and visibility in the heatmap.
- Provide feedback: Allows other users to provide feedback on annotations for published, publically viewable datasets on CAP. Users can agree or disagree with the annotation, or indicate that they are unsure.
- Differential expression: Can be done using all other cells or a custom set of selected cells to use as a reference. Additionally, the default is to run differential expression with downsampling for faster speed but this can be modified to use all cells.
- Cell labels: Existing cell labels can be edited and new cell label annotations with associated cell metadata can be created in edit mode.
- Metadata: Other metadata, such as assay, disease, organism and tissue, can also be displayed on the embedding by selecting the desired metadata field from the side bar.
- Embedding settings: If the dataset contains more than one embedding, you can select the embedding to display using the dropdown box in the bottom left part of the embedding, as well as adjust the zoom and download the embedding.
